
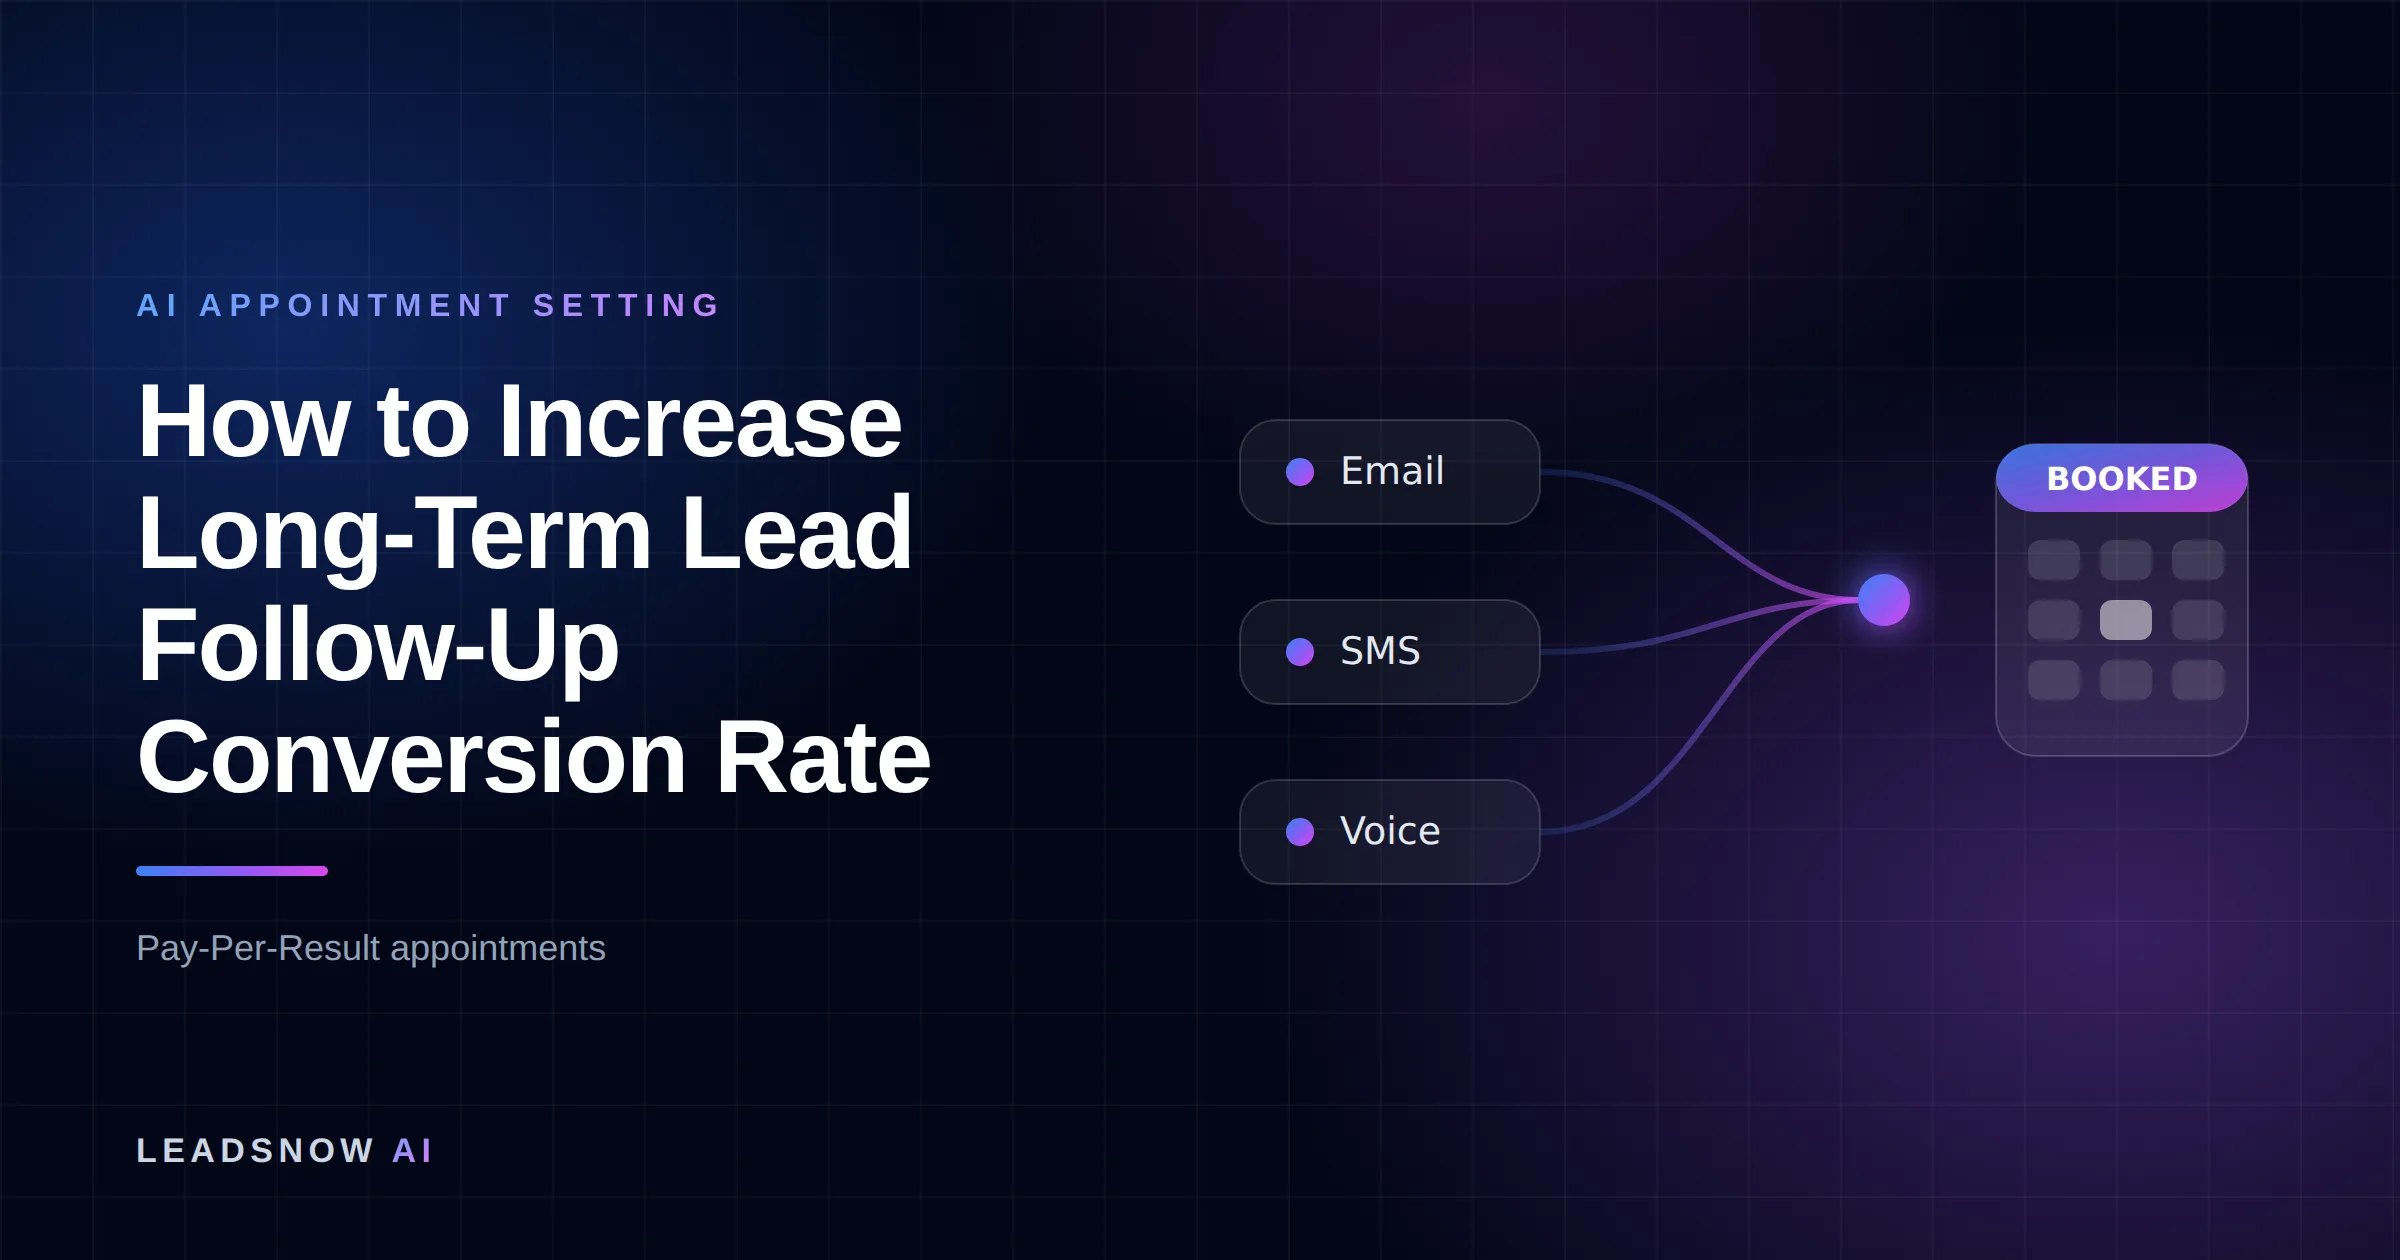
Long-term follow-up conversion rate is the share of leads still unconverted at day 31 that go on to book or buy by day 365, measured by entry cohort. The lever with the largest effect is touch count in months 2 to 12: in the CRMs we audit we typically find three or four logged touches after week two. Our own operating practice runs about 30 conversations across 12 months.
At a glance
- The metric: conversions between day 31 and day 365 ÷ leads alive and not disqualified at day 31, grouped by the month the lead first enquired.
- Read window: you cannot read the number until the cohort is 12 months old. Anything earlier is a partial curve.
- Lever ranked first by effect size: touch count in months 2–12. Second is not deleting the cohort.
- The decision rule: the reason-per-touch rule — if you cannot write the reason for a touch in one line without the words “checking in”, the touch does not get sent.
- The honest cost: 22 touches per lead across months 2–12, at six minutes each, is 1,980 hours a year on a pipeline of 900 open long-term leads — 1.13 full-time equivalents doing nothing else.
- Cut from this page: the “80% of sales need five follow-ups” figure. It traces to a 1942 survey of fewer than 40 people. See the FAQ.
How is long-term follow-up conversion rate actually calculated?
Long-term follow-up conversion rate has one formula and one trap. The formula:
Long-term follow-up conversion rate = (leads from entry month M that convert between day 31 and day 365) ÷ (leads from entry month M still unconverted and not disqualified at day 31)
The trap is the denominator. Most CRMs report conversions by the calendar month the deal closed, which mixes leads that enquired last week with leads that enquired last October and tells you nothing about follow-up. You have to group by entry cohort — the month the lead first raised their hand — and then watch that cohort age. One check is worth running before you calculate anything at all, and it is a check on inputs rather than on performance. Find the oldest entry cohort in your CRM that is now at least 13 months old, and count, for each of its leads that was still open at day 31, how many touches were actually logged from month seven onward. Then divide touches sent by touches scheduled for that cohort. The ledger further down this page schedules 22 touches across months 2–12; against the three or four we typically find, that is a sent-to-scheduled ratio of roughly 0.15. Below about 0.8 the formula will still return a number, but the number describes a schedule that was never run rather than the buyers it was meant to be run on, and no further measurement will tell you anything the ratio has not already told you. Get the ratio up first, then read the rate.
Disqualified leads leave the denominator; silent leads do not. Silence is not a verdict, and a team that marks quiet leads “lost” is deleting the exact population this metric is about. This page is one stage in our sales pipeline stages series, which indexes each stage of the pipeline — speed to lead, contact rate, set rate, show rate, close rate — as its own measurable number.
How it works
How to lift long-term follow-up conversion rate in four steps
Define the entry cohort
Group leads by the month they first enquired. Anyone still unconverted and not disqualified at day 31 enters the long-term cohort.
Write every reason first
Before month two runs, write the reason for each touch from week three to month twelve. If the reason needs the words checking in, the touch does not get sent.
Hold the cadence, honour triggers
Run the monthly rhythm across all open cohorts at once. Any reply, pricing visit or reopened quote overrides the calendar and moves the lead to a person the same day.
Score at equal cohort age
Record each cohort’s conversion rate at day 90, day 180 and day 365. Compare cohorts only at the same age, never a mature one against a young one.
MAKE MORE SALES.
Pay-Per-Result pricing — We scale sales HARD aligned to your interests, better than anyone else.
Why you cannot read this number until the cohort is 12 months old
A 12-month metric read at month three is not a low number, it is an incomplete one, and teams kill working programs on the strength of it every year. The conversions you are measuring have not had time to happen: a lead who told you “after the contract ends in June” is not a failure in March.
How long the curve needs to run is set by your buyers, not by your patience. Professor John Dawes at the Ehrenberg-Bass Institute derives the 95-5 rule from interpurchase interval: where firms change provider roughly every five years, only about 20% of the market is in-market in any given year and about 5% in any given quarter. Run that arithmetic on your own replacement cycle and it tells you the read window directly — a 90-day follow-up horizon against a five-year cycle is contesting 5% of your addressable demand and ignoring the other 95%.
Report it as a maturing curve instead of a single figure. For each entry cohort, publish the conversion rate at day 90, day 180 and day 365, and only compare cohorts at the same age. Cohort A at day 180 versus cohort B at day 180 is a fair comparison; cohort A at day 365 versus cohort B at day 90 is not a comparison at all.
Want this done for you? We book qualified sales appointments on a Pay-Per-Result basis — you only pay for calls that actually land in your calendar.
The levers that move long-term follow-up conversion rate, ranked by effect size
This ranking is our own ordering from running these campaigns, not a controlled study, and we have not published an isolated effect size for each lever. What each row does give you is a test you can run inside 30 days, before the cohort matures.
| Rank | Lever | What it changes, in numbers | How to test it in 30 days |
|---|---|---|---|
| 1 | Touch count in months 2–12 | In the CRMs we audit we typically find 3–4 logged touches after week two. Our practice runs 22 in that window (touches 9–30). That is the difference between being present in about 2 of 12 months and in 12 of 12. | Open 20 leads aged 60+ days in your CRM and count the logged touches. The real number is almost always lower than the team guesses. |
| 2 | Cohort survival — not deleting the denominator | A 90-day auto-archive rule removes 9 of the 12 months in which this metric can convert. The rate then reads as a follow-up failure when it is a data-retention decision. | Query how many records were set to lost, archived or unqualified after day 60 with no logged human contact. |
| 3 | A stated reason on every touch | Measured by replies and unsubscribes per 1,000 sends, not opens. Opens have been unreliable since mail-privacy prefetching; replies and unsubscribes are not. | Print your last 10 nurture messages. Cross out every one whose reason you cannot state in a single line. In the sequences we audit, more than half usually fail. |
| 4 | Trigger response time | A month-seven lead who opens a pricing link at 9.40pm is in-market that night. The gap between a reply in minutes and a reply at tomorrow’s stand-up is a full business day of someone else’s selling. | Timestamp link-click to first reply on your last 20 re-engagements. The evidence on first-response speed sits on our speed to lead and the 5-minute rule page. |
| 5 | Channel width | Email only reaches one inbox. Email plus SMS plus a voice touch reaches three. A silent deliverability failure on a single channel zeroes an entire cohort without any visible error. | Send the same reason on a second channel to half the cohort for one month and compare reply rates. |
| 6 | A written retirement rule | Without one, hard-bounced and unsubscribed records sit in the denominator forever and the rate declines for reasons unrelated to follow-up. | Count records with a hard bounce, an unsubscribe or a stated “no” that are still counted as open. |
A note on our own lift numbers, stated as ours. Across the campaigns we run, a client still operating the 2020 way — one salesperson, a spreadsheet, follow-up that stops when the week gets busy — typically sees something in the order of a 300% lift in conversion from the same paid traffic once the whole stack is fixed. That is an operator claim from our own client work, not research: there is no published sample size or window behind it and we will not dress it up as one. It also does not decompose cleanly. We would put speed to lead alone at roughly 3x and doubling contact rate at roughly 2x, and 3 × 2 is 6, not 3. The levers overlap — a faster first response is part of how contact rate improves, and long-term follow-up largely recovers leads the first two levers already touched — so the parts do not multiply. The one figure we do publish with a stated method is a 7x average sales lift, defined on our methodology page as trailing three-month closed-deal revenue at month six of engagement over the three months before launch, averaged across clients who supplied both numbers; the same page discloses that the median is closer to 4x. Long-term follow-up is one contributor to that average and we have not isolated its share.
What to change first: the reason-per-touch rule
The reason-per-touch rule: before a touch is scheduled, write the reason for it in one line, in the recipient’s words. If the line needs the phrase “checking in”, “touching base” or “following up” to make sense, the touch has no reason and does not get sent.
This is the first change to make because it is free, it takes an afternoon, and it is the whole answer to the objection every team raises: we will annoy them. The rule settles that objection by taking frequency out of it. A touch that passes the rule arrives carrying its reason in the first line, so the recipient judges it on that reason and can act on it or ignore it in a second. A touch that fails the rule carries nothing to justify itself, so the only thing it can be read as is a request to supply an answer the recipient has already declined to supply — and that is as true of the fourth one in a year as of the thirtieth. The objection is testable rather than rhetorical, too: apply the rule to the sequence you already run, then compare unsubscribes per 1,000 sends on the touches that survive against your pre-rule baseline. It is the touches with no stated reason that the unsubscribes follow.
Apply it to what you already send before adding anything: in the sequences we audit, more than half the scheduled touches typically fail the test and can be deleted outright, which improves the metric before a single new message is written.
If we can’t make you money, we don’t deserve yours.
Pay-Per-Result pricing — performance-based alignment.
The 12-month reason ledger: touches 9 to 30
Touches 1 to 8 belong to the first fortnight and are a different problem — that is speed and contact rate, and it is covered on our long-term lead nurture with AI follow-up page. The table below is the part almost nobody writes down: the 22 touches between week three and month twelve, each with the reason the recipient actually sees. These rows are LeadsNow operating practice across trades, professional services, finance and B2B pipelines, not external research. Tune the timing to your sales cycle; keep the shape.
| Touch | When | Channel | The reason the recipient sees |
|---|---|---|---|
| 9 | Week 3 | A written answer to the exact objection they raised, quoting their own words back | |
| 10 | Week 5 | One client result from their industry, with the number in the subject line | |
| 11 | Week 7 | A benchmark for the metric they said was their problem, so they can measure themselves | |
| 12 | Month 3 | SMS | Their own stated date: “you said you’d revisit after the contract ends — is that still the timing?” |
| 13 | Month 3 | The answer to a question they did not ask but every buyer at this stage asks | |
| 14 | Month 4 | A deadline that genuinely applies to them — EOFY, licence renewal, budget reset | |
| 15 | Month 5 | Something that changed on our side which removes the blocker they named | |
| 16 | Month 5 | A one-line note with a link to something useful that is not ours, and no ask at all | |
| 17 | Month 6 | Six-month re-qualification, stated plainly: is the same person still deciding this? | |
| 18 | Month 6 | A change in their market or their competitors’ behaviour, not ours | |
| 19 | Month 7 | A worked calculation using the numbers they gave us on the first call | |
| 20 | Month 7 | SMS | An updated result from the client whose situation is closest to theirs |
| 21 | Month 8 | The objection that killed a comparable deal, and what it cost that buyer | |
| 22 | Month 8 | A checklist they can use whether or not they ever buy from us | |
| 23 | Month 9 | Enquiry anniversary: “nine months ago you were solving X — did you solve it?” | |
| 24 | Month 9 | Consent refresh — an explicit, easy “do you still want these?” | |
| 25 | Month 10 | Evidence published since they enquired that did not exist at the time | |
| 26 | Month 10 | SMS | A genuine constraint on us: capacity, intake windows, lead times |
| 27 | Month 11 | Voice | Their stated timeframe has arrived — the one they named 11 months ago |
| 28 | Month 11 | The loose end: the one question from the first call that was never answered | |
| 29 | Month 12 | Close the loop and offer a real choice: yes, no, or a date to come back | |
| 30 | Month 12+ | Retire with a stated reason, or re-cohort against a new trigger — and say which |
Every row in that ledger is a reason, so every row passes the reason-per-touch test by construction. The dates are the weakest column in it. They are only a default for a lead who has done nothing you can observe, and the moment one does something observable — a month-five lead opening a pricing page counts — the ledger stops applying to that lead and a person picks the conversation up the same day. Nobody who is mid-conversation with you should still be receiving row 16.
What 30 conversations per lead actually costs to run by hand
This is the part that decides the question, and it is arithmetic rather than argument. Substitute your own inputs.
- You generate 100 enquiries a month.
- Assume 8 convert or are disqualified inside 30 days. The other 92 enter the long-term cohort.
- With a 12-month retirement rule, at steady state you carry roughly 92 × 12 = 1,104 open long-term leads, less those who convert, unsubscribe or get retired along the way. Call it 900.
- Months 2–12 carry 22 touches per lead (touches 9–30 above).
- A conversation that carries a real reason takes about six minutes: read the lead’s history, write the reason, send it, handle the reply. A “just checking in” blast takes twenty seconds and does not count, because it is the thing the metric punishes.
900 leads × 22 touches = 19,800 conversations a year. At six minutes each that is 118,800 minutes, or 1,980 hours. A full-time Australian week is 38 hours under the National Employment Standards (Fair Work Ombudsman); across 46 working weeks — 52 less four weeks of NES annual leave and roughly two weeks of public holidays — that is 1,748 nominal hours a year. So the long-term follow-up alone is 1.13 full-time equivalents — and that is nominal hours, with no allowance for meetings, training, admin or the fact that nobody spends 100% of a working year writing follow-ups.
The 1.13 FTE is not the number that actually stops teams, because it is knowable and a business can simply decide to fund it. What stops them is when the bill falls due relative to the evidence. Under a 12-month retirement rule the first cohort does not mature until month thirteen, so all 1,980 hours are spent for a full year before there is a single readable cohort to justify them — and each of those months adds another 92 leads to a standing obligation that nothing has yet left. The cost is therefore at its highest, and its least defensible, in exactly the window where someone is deciding whether to keep paying it. That is the honest reason the CRMs we audit stop at three or four logged touches, and the outcome then gets recorded as “the lead went cold”.
Do it by hand or hand it over: where the crossover sits
Below a few hundred open long-term leads, this is a discipline problem and buying software will not fix it. Above roughly 800, it stops being a workload a person can hold. The crossover is arithmetic, not opinion.
| Open long-term leads carried | Conversations/yr (22 each) | Hours/yr at 6 min | FTE (1,748 h) | The sensible answer |
|---|---|---|---|---|
| Under 100 | Up to 2,200 | Up to 220 | 0.13 | By hand. A disciplined founder can genuinely hold 100 relationships for a year. |
| 100–300 | 2,200–6,600 | 220–660 | 0.13–0.38 | By hand, but only with the 22 reasons written down first. Calendar reminders are enough tooling. |
| 300–800 | 6,600–17,600 | 660–1,760 | 0.38–1.01 | Half to one person doing nothing else. Automate the sending; keep the replies human. |
| 800–2,000 | 17,600–44,000 | 1,760–4,400 | 1.01–2.52 | Not a human workload. Either cut the cadence honestly or run it as a system. |
| Over 2,000 | 44,000+ | 4,400+ | 2.5+ | Systems only. Every manual version of this fails at the first staff change. |
Two honest caveats on our side of that table. A system holds the cadence but it does not invent the reasons — someone still has to write the 22 lines, and if they are generic the automation just distributes generic faster. And if the leads in the cohort were never qualified in the first place, twelve months of excellent follow-up produces twelve months of excellent follow-up and no revenue. Running the cadence is what we do as AI lead nurture and long-term follow-up in Australia, and re-engaged leads land as booked AI appointment setting slots on a calendar; the reasons are still built from what your buyers actually say.
When to stop, and what the Spam Act says about a nine-month-old consent
Retire a lead when they say no, when the data goes bad, or when your retirement rule fires — never because a calendar says the record is old. But there is a legal boundary on the other side that most 12-month nurture advice ignores entirely.
In Australia, marketing email and SMS is governed by the Spam Act 2003. The ACMA’s guidance is specific: every commercial message must carry an unsubscribe option that honours a request within 5 working days, remains functional for at least 30 days after sending, costs nothing, and does not require the person to log in or hand over more personal information. Consent can be express or inferred, but ACMA is explicit that inferred consent applies where there is a provable, ongoing relationship and the marketing is directly related to it — and that inferred consent is not as reliable as express consent. A person who filled in an enquiry form nine months ago and has not replied since is the case worth checking — unless that form carried a clear marketing-consent statement, in which case ACMA treats it as express consent and the age of the enquiry is not the issue. Without such a statement you are leaning on inferred consent, and inferred consent gets thinner the longer the silence runs.
The operational answer is touch 24 in the ledger: an explicit consent refresh at month nine, offering an easy exit. It costs a small number of records and it makes months 10 to 12 defensible. This is general information rather than legal advice — check your own position, and note that a dormant list which has gone completely quiet is a database reactivation problem rather than a nurture one; our own Colliers-era reactivation campaigns averaged 4.4% with an 8.9% peak, which is our record, not an industry benchmark.
Frequently asked questions
Is it true that 80% of sales need five follow-ups?
There is no credible source for it, so it is not used on this page. The number traces back to a survey run in 1942 by the Long Island chapter of what is now Sales & Marketing Executives International; SMEI’s own write-up states the sample size was fewer than 40. The related family of “National Sales Executive Association” statistics was investigated by VentureBeat in 2014, which reported that the association does not appear to exist and the figures are fabricated. The underlying advice — persist past four touches — is sound, but it should rest on your own cohort data, not on a wartime survey of 40 people.
Why does the overdue follow-up queue keep growing no matter how disciplined the team is?
Because the queue compounds and almost nothing leaves it for a year. On 100 enquiries a month with roughly 92 entering the long-term cohort, month one owes you about 92 touches; by month four you are servicing four cohorts at once, and under a 12-month retirement rule the first records do not retire until month thirteen. Discipline holds for the first two cohorts and then loses to arithmetic, which is why the overdue queue is the thing that gets bulk-archived. The two honest responses are to cut the cadence deliberately and say so, or to hand the scheduled sending to a system and keep the replies human. Marking the overdue records “lost” is neither, and it is the one that destroys the metric quietly.
Does a lead who replies but never books count as a conversion?
No, and keeping the two apart is what stops this metric being gamed. A reply is engagement; a conversion is a booking or a purchase, and only conversions belong in the numerator. Track replies separately as a leading indicator — they tell you whether the reasons on your touches are landing months before the cohort matures — but the moment a reply counts as a conversion, the fastest way to lift the number is to ask more questions and book fewer meetings. A reply does change one thing: it is a trigger, so it pulls the lead out of the scheduled cadence and onto a person the same day.
How do I calculate the rate when leads convert at different times?
Group by entry cohort and compare cohorts only at equal age. Publish the conversion rate for each cohort at day 90, day 180 and day 365, so a cohort that is four months old is never compared against one that is thirteen months old. The single most common error is reporting conversions by close month, which mixes fresh and aged leads and makes the follow-up program invisible in its own report.
Does the Spam Act let you email someone who enquired eleven months ago?
It turns on what the form said, not on how old the enquiry is. If the enquiry form carried a clear marketing-consent statement, the ACMA treats that as express consent and eleven months of silence does not weaken it. If it did not, you are relying on inferred consent, which the ACMA says applies where there is a provable, ongoing relationship and the message is directly related to it — and which it states plainly is not as reliable as express consent. Either way every message needs a working unsubscribe honoured within 5 working days, and the month-nine consent refresh in the ledger above costs a small number of records and makes months 10 to 12 defensible. General information, not legal advice.
What is a good long-term follow-up conversion rate?
There is no honest published benchmark for it, because almost nobody measures it the same way — the denominator, the disqualification rule and the retirement rule all move the number by more than any realistic performance difference. Use your own first mature cohort as the baseline and improve against it. If you want an external anchor, the useful one is the arithmetic above: the share of your buyers who will enter the market in the next 12 months.
Pay-Per-Result appointments
See if we’re a fit
We book qualified sales appointments for you and you pay on results, not retainers. Our booking page asks a few quick questions so you find out in two minutes whether that model suits your business.
- 50,769+ appointments booked without cold calling.
- Pay-Per-Result pricing — you pay for booked, qualified calls.
- Pick your own time on our live calendar, no phone tag.