
Sales pipeline analytics is the practice of measuring how deals move through your sales stages so you can predict revenue and fix what’s slowing deals down. Start with five numbers: pipeline coverage ratio, pipeline velocity, win rate, average deal size, and stage-to-stage conversion rates. Once those live on one dashboard reviewed weekly, you have a decision-ready view of the pipeline instead of a guessing game.
TL;DR:
- A pipeline coverage ratio of 3x to 4x against revenue goals is standard, requiring three to four dollars in pipeline for each dollar of quota.
- Pipeline velocity combines opportunity count, deal size, win rate, and sales cycle length to measure how quickly revenue moves through the system.
- Tracking stage-to-stage conversion rates and median time-in-stage reveals bottlenecks, especially when long dwell times accompany low conversion rates.
- Regularly reconciling CRM data and establishing clear stage ownership prevent metrics from drifting and ensure reliable pipeline analysis.
- Improving lead quality and pre-qualifying appointments can significantly enhance pipeline metrics, often more than process tweaks or analytics alone.
Table of Contents
- What Sales Pipeline Analytics Actually Measures
- The Core Metrics Every Sales Leader Should Track
- How to Collect and Model Your Pipeline Data
- Finding and Fixing Pipeline Bottlenecks
- Predictive Scoring and Forecasting Beyond the Basics
- Connecting Pipeline Analytics to Sales and Marketing Strategy
- Keeping Your Pipeline Data Clean Over Time
- What Most Sales Leaders Get Wrong About Their Own Pipeline
- When It’s Time to Bring in a Pay-Per-Result Partner
- Sources
- FAQ
How it works
How an AI sales agent books your appointments
Your list or CRM
We start from data you already own — past enquiries, dormant customers, or a targeted prospect list.
The agent makes contact
Email, SMS and voice, with follow-up that persists for weeks instead of stopping after two attempts.
Qualified against your rules
Budget, timing and fit are checked before anything reaches your team, using criteria you set.
Booked into your calendar
Only qualified prospects reach the booking step, so your closers spend their time selling.
MAKE MORE SALES.
Pay-Per-Result pricing — We scale sales HARD aligned to your interests, better than anyone else.
What Sales Pipeline Analytics Actually Measures
Pipeline and funnel aren’t the same thing, and mixing them up wrecks your math. A funnel tracks volume moving through marketing and sales stages toward a single conversion event. A pipeline tracks active opportunities with dollar values attached, at a specific point in time, owned by a rep. Confuse the two and your coverage ratio will lie to you.
Before you calculate anything, pick your unit of analysis. Are you measuring by account or by contact? A single account with three stakeholders in three separate deals behaves very differently in your data than three individual contact records. Most B2B teams should analyze at the account or opportunity level, since that’s what actually closes and generates revenue.
Then lock in the operational basics:
- Stage entry and exit rules. Write down, in plain language, what has to be true for a deal to move from “Qualified” to “Proposal Sent.” Vague criteria produce vague reports.
- Time windows. Decide whether you’re measuring calendar days or business days in stage, and apply it consistently.
- Ownership. One person, usually revenue operations or the sales manager, owns the canonical stage definitions and runs a monthly reconciliation against CRM records.
Without that groundwork, every metric downstream inherits the mess.
Want this done for you? We book qualified sales appointments on a Pay-Per-Result basis — you only pay for calls that actually land in your calendar.
The Core Metrics Every Sales Leader Should Track
Five metrics do most of the diagnostic work, and each one answers a different question about pipeline health.
- Pipeline coverage ratio. Divide total pipeline value by your revenue target for the period. A 3x to 4x ratio is the common benchmark, meaning you need three to four dollars of open pipeline for every dollar of quota you’re chasing, since not every deal closes.
- Pipeline velocity. Multiply number of open opportunities by average deal size by win rate, then divide by average sales cycle length in days. This single number tells you how fast revenue is actually moving through the system, and it’s actionable because it combines four separate levers you can each pull independently.
- Stage-to-stage conversion rates. What percentage of deals entering each stage actually exit forward, rather than backward or dead? Track this per stage, not just funnel-wide.
- Time-in-stage, measured by median and percentile. Averages hide outliers. Look at the median time a deal spends in “Negotiation,” then check the 90th percentile. A big gap between the two tells you a subset of deals is quietly rotting.
- Win rate and average deal size. Track both the percentage and the raw counts behind it. A 40% win rate on eight deals means something completely different than 40% on two hundred.
Pipeline velocity can vary widely, with higher values indicating faster revenue movement, telling different growth stories even if win rates are similar. The velocity number exposes what the win rate alone hides.
Not every metric deserves the same attention on the same day. Here’s a simple cadence split:
| Cadence | Watch | Why |
|---|---|---|
| Weekly | Pipeline velocity, stage conversion, new pipeline added | Catches stalls before they become quarter-end surprises |
| Monthly | Coverage ratio, CAC/LTV, win rate trend | Strategic health check, less noise from weekly swings |
That weekly versus monthly split isn’t arbitrary. Operational metrics move fast enough that weekly review catches problems early, while deeper unit-economics review belongs on a slower, monthly rhythm.
How to Collect and Model Your Pipeline Data
You have two ways to build pipeline reports: snapshot-based or event-based. Snapshots capture pipeline state at a fixed moment, say every Friday at 5 p.m. Event-based modeling logs every stage change with a timestamp the moment it happens. Snapshots are easier to build. Event-based data is far more accurate, because it lets you reconstruct exactly how long a deal sat in each stage rather than just where it happened to be when you looked.
The most useful structure is a simple funnel table. For each stage, record the count entering, count exiting, the resulting conversion rate, and the median time in stage. Building this table from stage-movement events rather than end-of-period snapshots avoids double-counting deals that get recycled back into earlier stages.
Three dashboard views cover almost everything a sales manager needs:
- Snapshot view. Total pipeline value and count, sliced by stage, rep, and source, as of today.
- Waterfall or movement view. Shows deals added, pushed to a later close date, pulled forward, or lost, quarter over quarter, which exposes forecast risk long before the quarter ends.
- Stage-duration histograms. Plot time-in-stage at the 50th, 90th, and 95th percentile, the same percentile-panel logic engineers use to find latency in software systems, applied to where your deals actually get stuck.
Pro Tip: Spot-check twenty closed deals end to end once a quarter. Trace each one through every stage timestamp and confirm the dates make sense. It takes an afternoon and catches broken automation rules before they poison a full quarter of reporting.
If we can’t make you money, we don’t deserve yours.
Pay-Per-Result pricing — performance-based alignment.
Finding and Fixing Pipeline Bottlenecks
Conversion rate alone tells you a stage is leaky. Time-in-stage alone tells you a stage is slow. Read them together and you find the real bottleneck. A stage with low conversion but fast exits usually means bad qualification upstream. A stage with high conversion but long dwell time usually means a process delay, like a legal review or a pricing approval that nobody owns.
Once you’ve spotted a stalled stage, segment before you diagnose:
- By lead source. Deals from paid ads often convert differently than referrals or outbound, and blending them hides which channel is actually underperforming.
- By rep. If one rep’s deals stall at “Proposal Sent” while others don’t, that’s a coaching problem, not a process problem.
- By deal size or product line. Enterprise deals stall for different reasons than self-serve ones; a single stage-duration number across both is close to meaningless.
From there, run a tight experiment rather than a broad initiative. Test a revised qualification rubric on new leads only. Try a faster follow-up cadence on one rep’s book for thirty days. Run targeted enablement on the specific objection showing up in lost-deal notes. Pick one constraint metric per stage and run two or three of these experiments a month, rather than trying to fix everything at once.
Finally, set a rule for stalled deals: anything sitting untouched past double the median time-in-stage gets flagged for manager review, and gets closed-lost or reassigned if there’s no activity within a set window. A pipeline padded with zombie deals inflates coverage and wrecks forecast accuracy.
Predictive Scoring and Forecasting Beyond the Basics
Once your basic metrics are trustworthy, predictive lead scoring adds a probability estimate to every open deal, built from deal attributes, activity history, and stage velocity rather than gut feel. But a model is only as good as its validation.
- Backtest before trusting it. Run the model against last year’s closed deals and see if predicted outcomes match what actually happened.
- Calibrate with probability bins. Group deals into bins like 70 to 80% predicted to close, then check whether roughly that share actually closed. If your 80% bin closes at 45%, the model is overconfident and needs retraining.
- Segment your forecast by product mix. A blended win rate hides the fact that your new product line closes at half the rate of your flagship offer, which throws off every forecast built on the combined number.
- Fix operations before you invest in machine learning. If stage definitions are inconsistent or reps enter data inconsistently, no model will produce a reliable score. Clean data first, sophisticated models second.
Predictive scoring pays off fastest for teams with high deal volume and consistent CRM hygiene. For smaller pipelines, a well-run manual review often beats a model trained on too little data.
Connecting Pipeline Analytics to Sales and Marketing Strategy
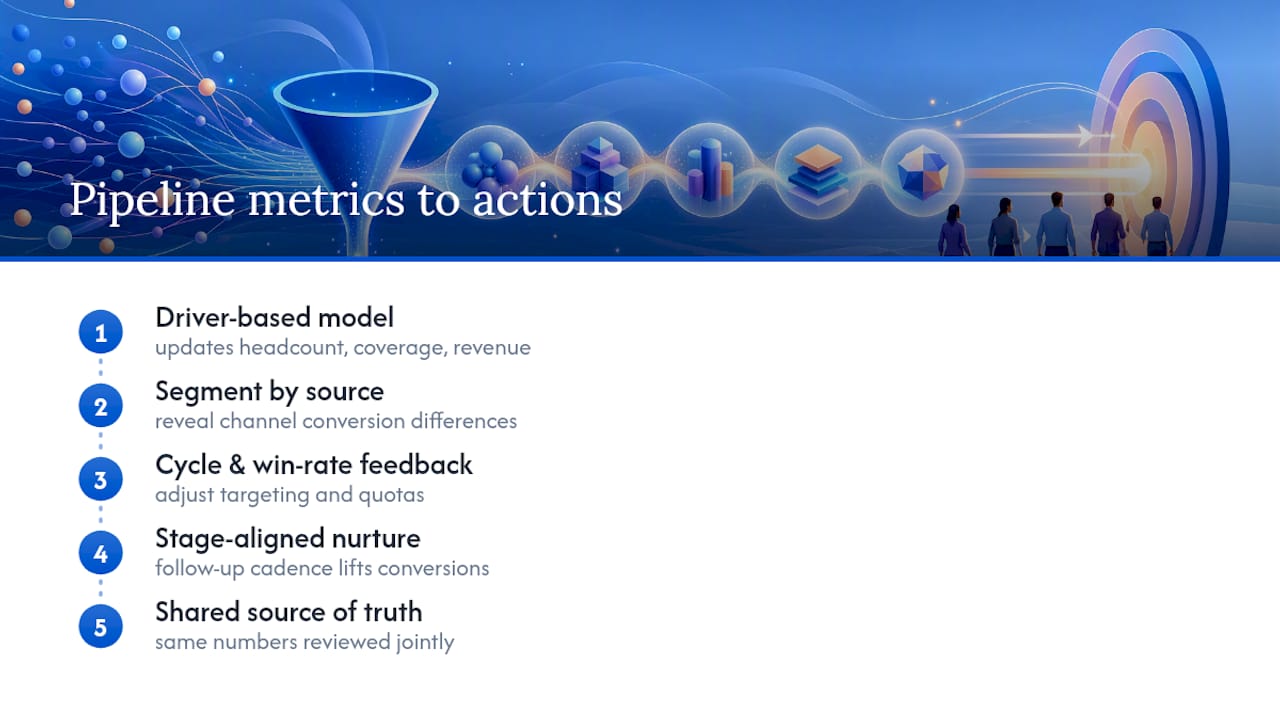
Pipeline metrics only matter if they change what marketing and sales actually do next. The most useful move is turning your funnel numbers into a driver-based model, where a change in stage conversion automatically updates your headcount plan, your pipeline coverage target, and your revenue forecast, instead of sitting in a slide deck nobody revisits.
In practice, that means marketing’s lead quality targets get set by what sales pipeline data actually shows converts, not by raw volume goals. If your analytics reveal that leads from one channel convert at half the rate of another, that’s a budget conversation, not just a sales conversation. A weak “Discovery to Proposal” conversion rate might mean sales needs a better qualification rubric, or it might mean marketing is sending unqualified leads. You can’t tell which without segmenting pipeline data by source, which is exactly why that segmentation step matters so much.
The reverse connection matters too. Sales cycle length and win rate by segment should feed back into how marketing targets accounts and how leadership sets quota. A business that consistently sees a 90-day cycle for enterprise deals but sets 60-day pipeline coverage targets is setting reps up to miss, no matter how hard they work.
This is also where lead nurturing strategy earns its place in the conversation. Structured nurture sequences that match follow-up cadence to where a lead sits in the funnel tend to lift stage conversion more reliably than generic follow-up. Pipeline analytics tells you where the drop-off happens; nurturing strategy is often the lever you pull once you know.
Treat pipeline analytics as the shared source of truth between departments, reviewed in the same meeting, using the same numbers, rather than sales and marketing each keeping their own version of the story.
Keeping Your Pipeline Data Clean Over Time
Pipeline analytics degrades fast without maintenance. Stage definitions drift as new reps join and interpret rules their own way. Fields go stale as deals sit untouched. Duplicate records creep in from marketing imports and manual entry. None of this shows up as an obvious error. It shows up as metrics that quietly stop matching reality.
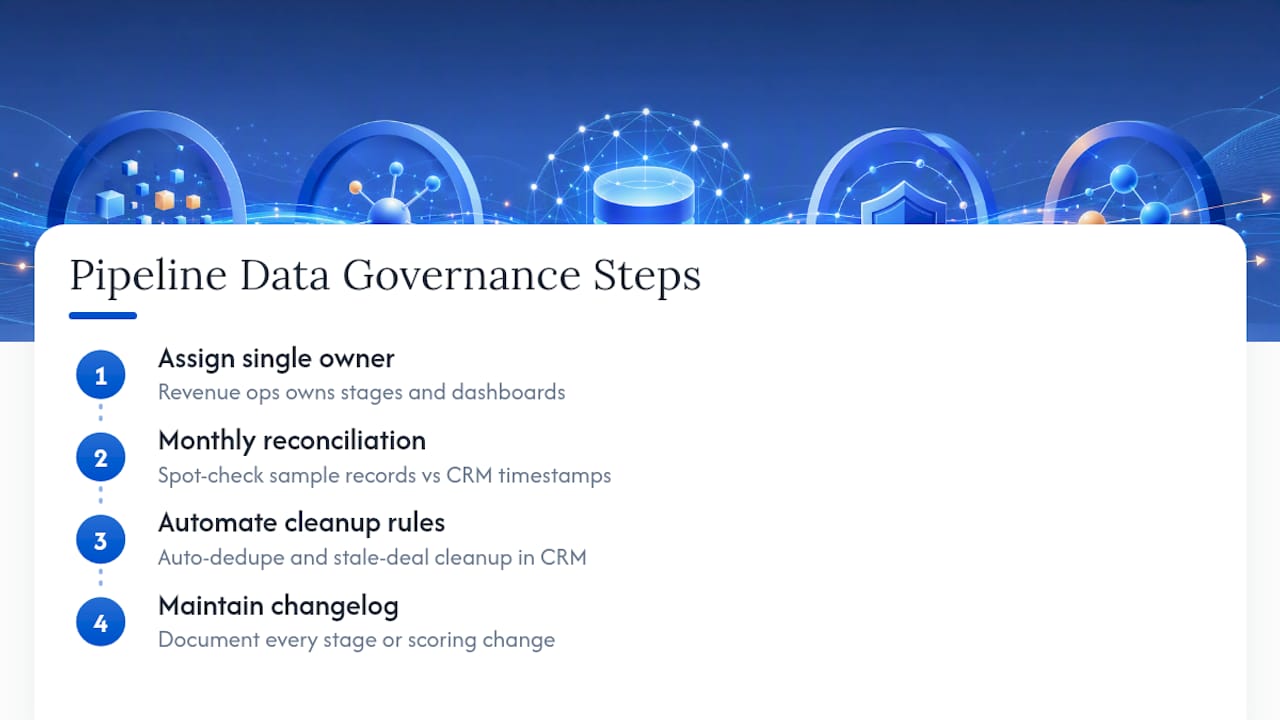
Assign clear ownership first. One person, usually in revenue operations, should own the canonical stage definitions and the dashboard logic, with authority to reject a “customization” that breaks the reporting model. Without a single owner, every regional team eventually invents its own version of “Qualified,” and your company-wide numbers become unusable.
Build a recurring reconciliation into the calendar, not just an ad hoc fix when something looks wrong. A monthly spot check of a sample of records, comparing CRM timestamps against what actually happened, catches broken automation before it compounds across a full quarter of reporting.
Set explicit rules for deduplication and stale-deal cleanup, and apply them automatically wherever your CRM allows it, rather than relying on reps to remember. Document every change to stage definitions or scoring logic in a changelog visible to the whole sales team, so a shift in the numbers has a clear, traceable cause instead of triggering a confused Slack thread. Pipeline governance isn’t glamorous work, but it’s the difference between a dashboard people trust and one they quietly ignore.
What Most Sales Leaders Get Wrong About Their Own Pipeline
The biggest blind spot in pipeline analytics isn’t a bad formula. It’s measuring outputs while ignoring inputs. A sales manager can build a flawless stage-conversion dashboard and still miss the real problem: not enough qualified opportunities entering the top of the funnel to make any of those downstream metrics meaningful.
Better lead quality changes every metric in this article simultaneously. When appointments arrive already qualified against clear criteria, stage-to-stage conversion improves because reps aren’t burning cycles on deals that were never going to close. Sales cycle length shortens because the discovery stage moves faster. Win rate climbs, not because reps got better overnight, but because the denominator got smaller and more relevant.
LeadsNow AI’s pay-per-result model illustrates the point at scale: clients have seen a 7x sales lift and over 50,769 AI-booked appointments delivered, against a backdrop where sales funnels commonly lose up to 97.3% of potential revenue to weak lead generation and follow-up. That “leaking bucket” problem is a pipeline-input problem, not a dashboard problem, and no amount of stage-duration analysis fixes a funnel that was never fed properly in the first place.
— Riley
When It’s Time to Bring in a Pay-Per-Result Partner
If your dashboards are clean but your top-of-funnel numbers keep telling the same story, not enough qualified leads, repeated drop-off before “Discovery” even starts, that’s not a data problem. That’s an input problem, and analytics can’t fix an empty funnel.
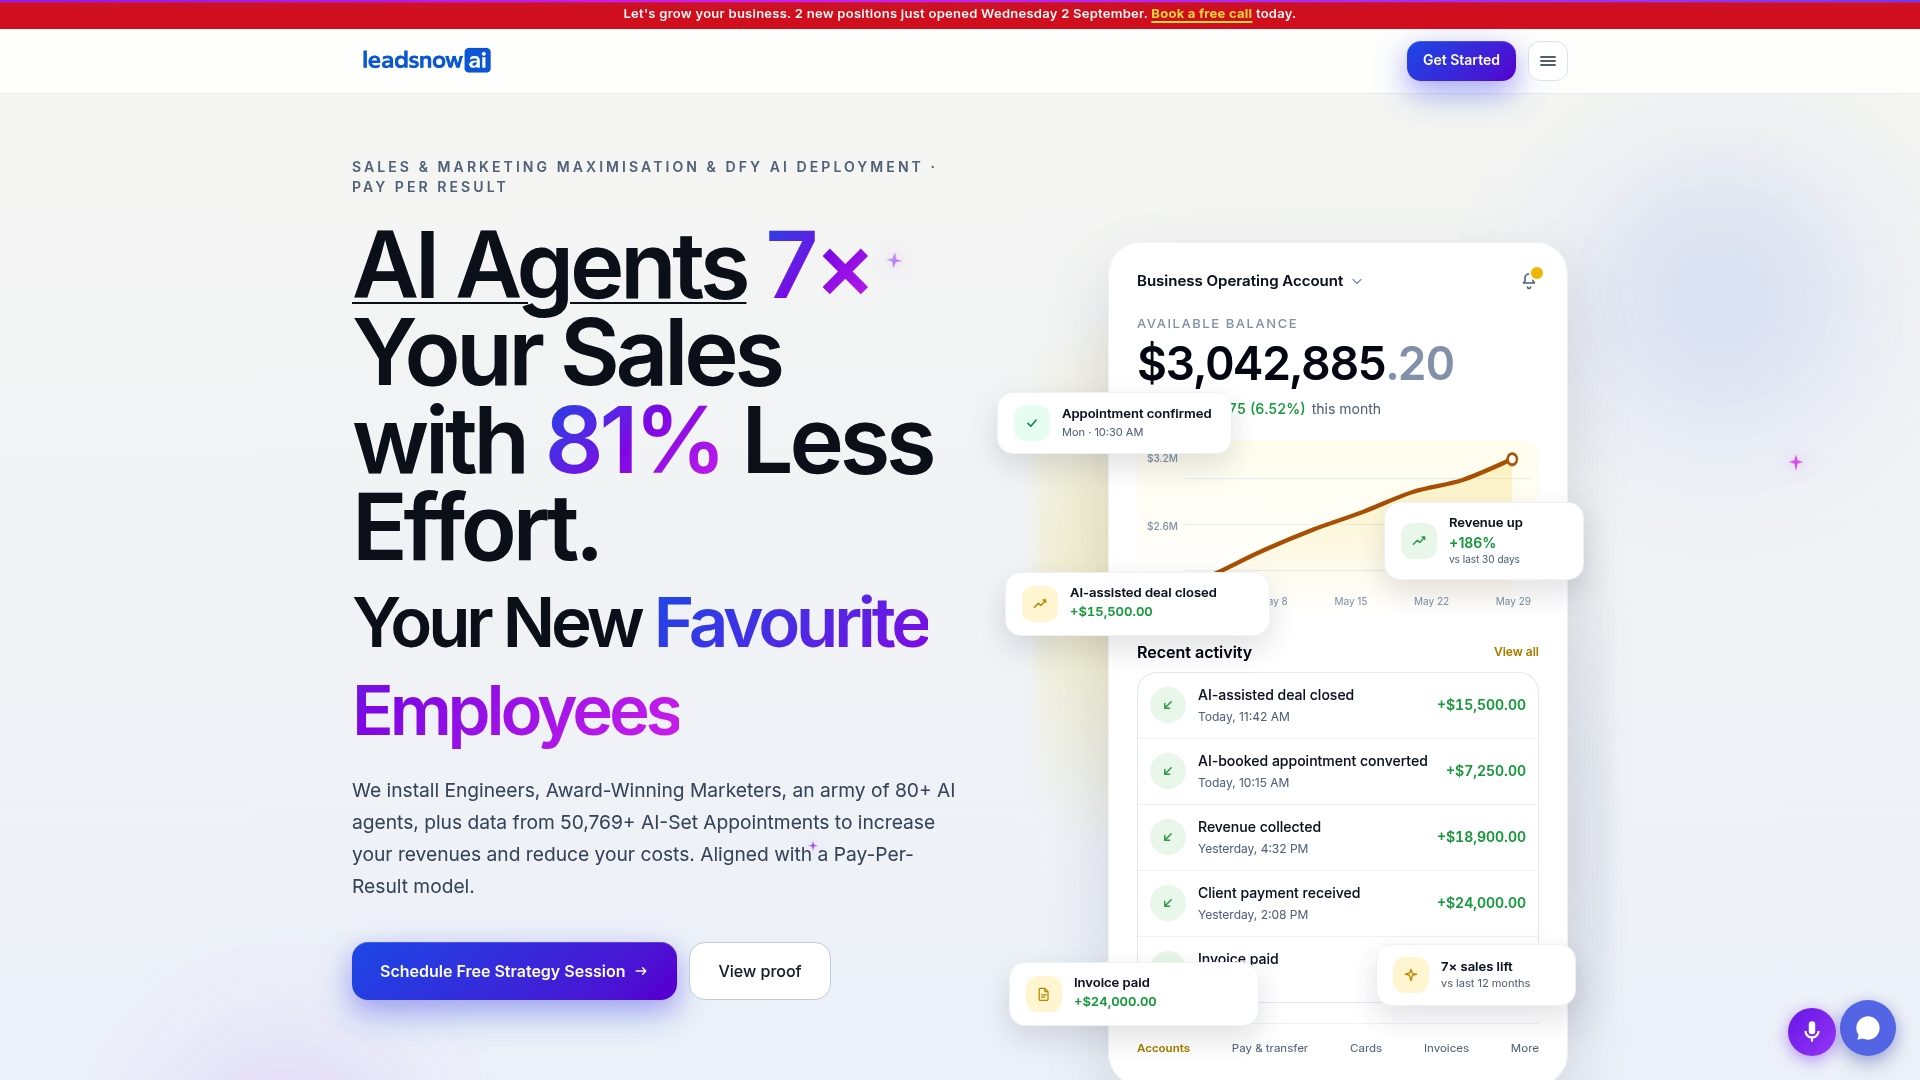
This approach is an alternative to hiring another internal SDR or paying a retainer to a traditional agency: payment is only made when a qualified appointment actually lands on the calendar, so costs are tied directly to pipeline results instead of activity. That structure means the leads feeding your pipeline analytics are already pre-qualified against your criteria before they ever enter your CRM, which is exactly the kind of input-quality fix the diagnosis above points to.
Clients using LeadsNow AI’s AI sales agents and continuous funnel optimization have seen results like a 7x sales lift and tens of thousands of AI-booked appointments delivered without retainers. If your fitness business, coaching practice, or consulting firm needs more volume at the top of the funnel rather than another dashboard, visit LeadsNow AI to see current benchmarks and case studies for your industry.
Sources
Three resources are worth bookmarking. Salesforce’s pipeline analytics template generates a waterfall chart straight from snapshotted CRM data. Model Reef’s step-by-step funnel guide walks through building a funnel table from scratch. RevSure’s pipeline dashboard breakdown explains movement views for forecast risk.
- Sales Pipeline Analysis: Complete Guide to Pipeline Health & Optimization
- How to Measure Sales Funnel Metrics | Model Reef
- Pipeline Analytics Dashboard | Track & Optimize | RevSure
- Observability metrics — Pipeline Framework
FAQ
What Is Sales Pipeline Analytics?
Sales pipeline analytics is the measurement and analysis of how opportunities move through defined sales stages, using metrics like conversion rate, velocity, and coverage ratio to predict revenue and find bottlenecks.
What Is a Good Pipeline Coverage Ratio?
Most B2B teams target a 3x to 4x pipeline coverage ratio against quota, meaning three to four dollars of open pipeline for every dollar of revenue target, since not every open deal closes.
How Do You Calculate Pipeline Velocity?
Multiply the number of open opportunities by average deal size and win rate, then divide by average sales cycle length in days; the result shows how fast revenue is actually moving through the pipeline.
What’s the Difference Between a Sales Funnel and a Sales Pipeline?
A sales funnel tracks volume moving toward one conversion event, usually across marketing and sales together, while a pipeline tracks active, dollar-valued opportunities owned by specific reps at a specific stage.
How Often Should You Review Pipeline Metrics?
Review pipeline velocity, stage conversion, and new pipeline added weekly, and save deeper metrics like coverage ratio trends and CAC/LTV for a monthly or quarterly cadence.
Can Better Lead Quality Improve Pipeline Metrics Without Changing Sales Process?
Yes. Feeding the pipeline with pre-qualified appointments, the approach LeadsNow AI’s pay-per-result model uses, tends to raise stage-to-stage conversion and shorten sales cycle length by removing unqualified deals before they ever enter the CRM.
Recommended
- 6 Fitness Business Lead Generation Hacks
- Database Reactivation: How We Hit 4.4% Average (and 8.9% Peak) Conversion on Dormant CRM Leads
- Effective Time Management For Fitness Coaches
- Some efficient tips for managing a gym successfully!
Pay-Per-Result appointments
See if we’re a fit
We book qualified sales appointments for you and you pay on results, not retainers. Our booking page asks a few quick questions so you find out in two minutes whether that model suits your business.
- 50,769+ appointments booked without cold calling.
- Pay-Per-Result pricing — you pay for booked, qualified calls.
- Pick your own time on our live calendar, no phone tag.